In last few days i decided to finish the prototype of my old memory tracer idea, which stayed in my drawer for some time already. Generally, i was trying to build it for Immunity Debugger Plugin Challenge but i had some problems with the debugger itself since it crashed most of the time while working with SpiderPig, so i've hacked some functions of the debugger itself, and now it's pretty stable - but guess its not suitable for the challenge so i will not submit it.
Main idea of SpiderPig is to trace a specified memory region (or specified register value), and also be able to trace all the childs regions that were created by refferencing to previously traced regions. So whenever a previously traced memory region will be refferenced or any other memory region which bases on previously traced memory region will be created, SpiderPig will snort it.
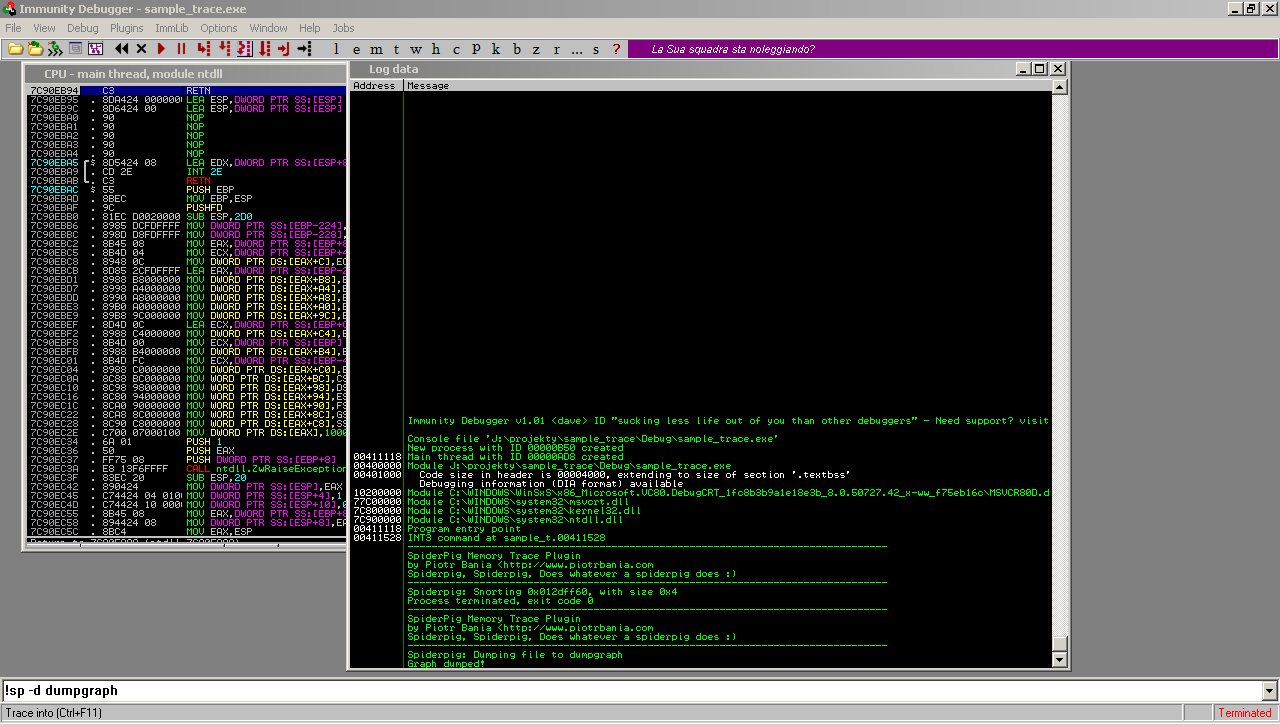
Since i don't want to speak about tracing technique itself, i will just show you some basic-sample output of the trace:
Following code will be traced (it's really dumb so don't try to think what it does, but look at the stack and global variables), of course i'm not tracing every intruction of the code, that would be to easy and to slow...
/* some gibberish */
/* some globals */
int g1 = 0;
int g2 = 0;
int g3 = 0;
int g4 = 0;
/* you can use following procedure in your own software if you want :) */
int sub1(int param1)
{
g1 = (param1 * 55) + GetTickCount();
g1 ^= 0x66;
g1 ^= 33;
return g1;
}
void yo(int param)
{
char buff[10];
g2 = g3 = param;
sub1(param);
memset((void*)&buff,0x0,param);
}
int main(void)
{
int our_param = 5; // <--- we will be tracing this _asm { lea eax,our_param int 3 }; // just an breakpoint if (our_param > 10)
return 0;
yo(our_param);
our_param = 0;
return 0;
}
#0 Tracing State (our_param = 555 (sample))
The condition (our_param > 10) is met, and we end the program execution, and that's how SpiderPig reports it:

#1 Tracing State (our_param = 5 (sample))
The condition (our_param > 10) is not met, and we continue the program execution, so here we have (click to expand):
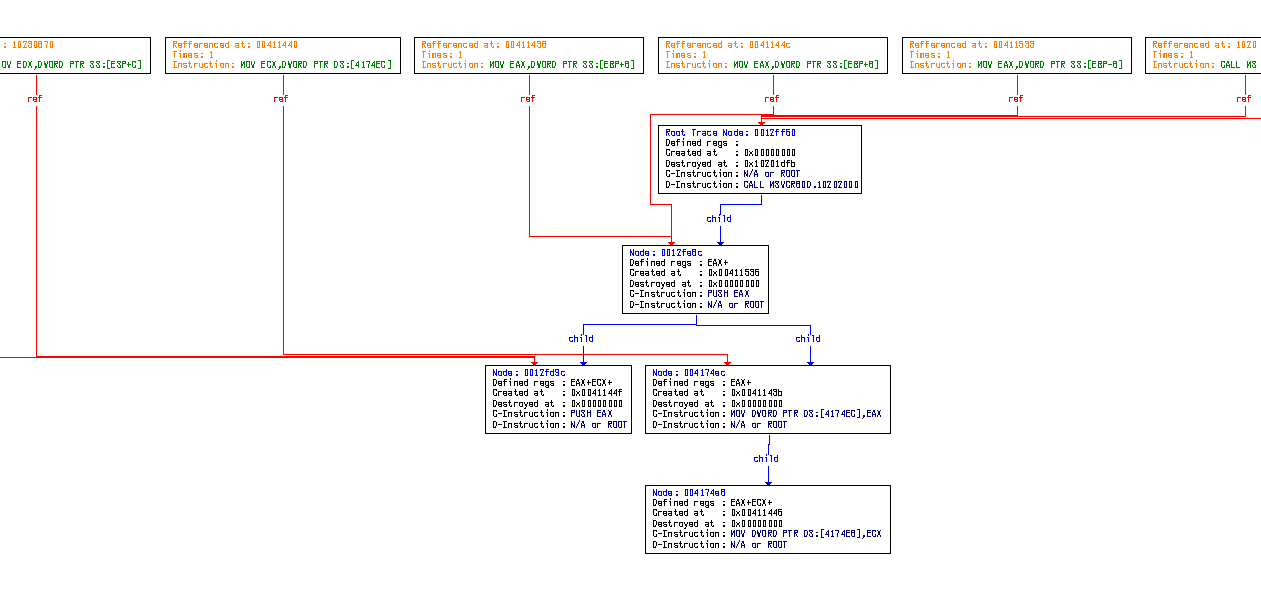
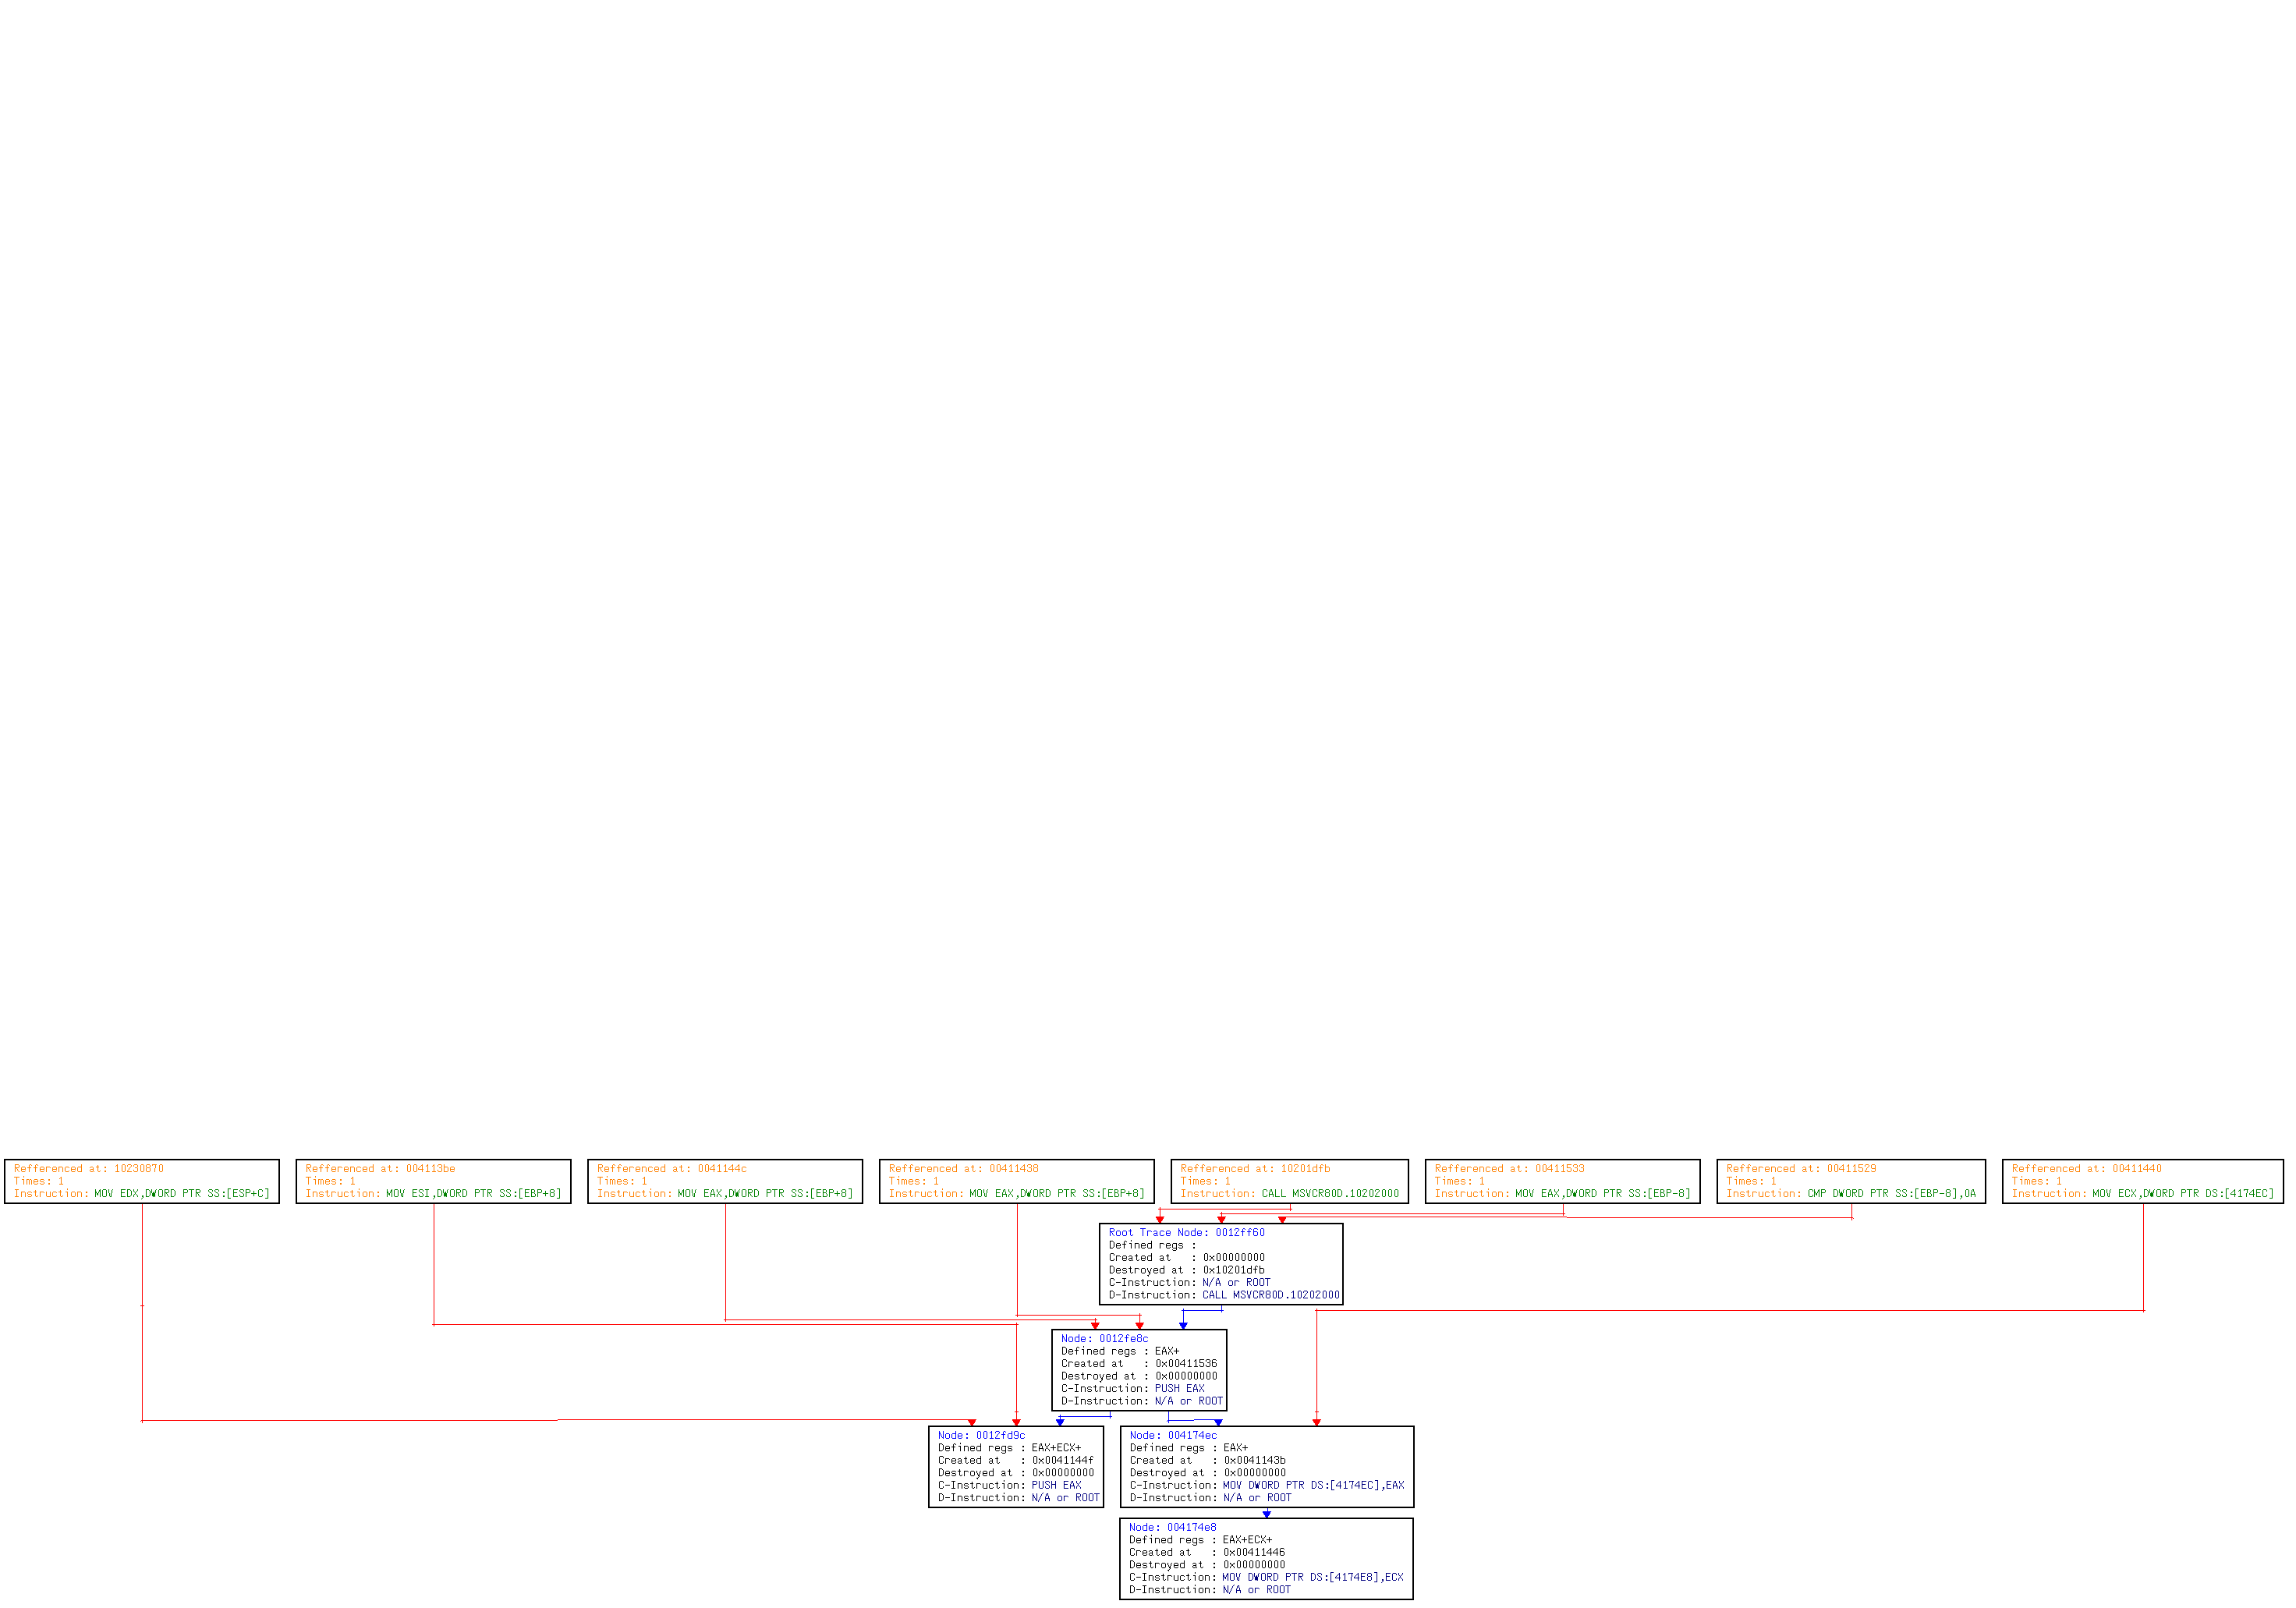
Also a clearer graph is available here
Graph Legend:
- blue node - shows the child node (child object)
- red node - shows the instruction wich refferenced the object
- Defined regs - shows the traced regs at current moment
- Created at - shows where the object was created
- Destroyed at - shows where the object was destroyed
#Conlusions
If you ever tried reversing something or some bug finding routines, sooner or later you will get tired of tracing memory variables that flows in all directions, SpiderPig is an idea to make it faster and less harmful task. Of course it's a prototype, there are many things to be done and many thing to be changed (because i think i missed some important points already :)). What i can say, stack tracing is really painful, so in future versions i will try to avoid it as far as i can, also currently it has some problems with larger applications.
So here's a little TODO list:
TODO:
- stable tracing driver
- take care of node dupilcation
- miniregions (and yes, they are not standard mini regions)
- stack tracing avoidance methods (heuristics)
- multithreading
That's all! *hrum* *hrum*

2 komentarze:
Hi Piotr, you are such a cool guy :)
You obviously contemplated about the frozen state of the executable during the debugging and thread syncing, however, when I found this on Microsoft dot com, I became concious of two things... how to very discretely check for a debugger, unrelated to existing techniques (you'll see the link by yourself, so draw your own conclusions :) and secondly, because lot of us doing the same job and reading the same material are using the same things, this one could be recognized, possibly, as heavy to circumvent, if properly implemented. We have all seen RDTSC workaround, then changing of the CONTEXT struct of the living thread (I won't even mention CreateRemoteThread and VirtualProtectEx functions, these are making me puke, even smurfs are using them nowdays...), recognizing additional checking threads from some unexpected place, but look at this and tell me do you see the same that I do? :)
http://support.microsoft.com/kb/q173260/
In order to open my sleeves to see that I'm open :) -> I'm thinking about synchro-primitives other than threads (such as semaphores, completion routines [heh heh] and waitable timers) in order to gain the timer functionality in such way that it will be interrupted in the moment any debugger attaches to a process :) Basically, you'll stop the thread, and along with the thread all the scheduled subtle synchronizations at that moment, or, satisfying enough, these will return slightly different values... so if we continue waiting in silence for let's say few hours (LoL)... it would be very amusing to see the face of the guy that is analyzing the code :)
Yo Vlaad, sorry for the delay in replying but it seems i'm currently hella busy :/
Well i think i got your point, one of my older techniques regarding catching the moment of a debugger attaching was hooking the NtContinue (url: http://piotrbania.com/all/anti-dattach.asm).
I think i already saw the antidebugger techniques which were basing on the synchronizaction methods. Including some of the most pure examples like creating a thread and then using WaitForSingleObject API with some cool ammount of time as the dwMilliseconds parameter. And yes they may be the pain in the reverser's arse :)
But from the other hand in the SpiderPig tracer output i was just playing with the data flow graph, it simply illustrates when some critical condition is not met the flow changes "drastically". I'm currently ending the new SpiderPig called Espada and it's currently basing on some more stable algos, but this is up to come i guess.
cya
Post a Comment